
F1 telemetry data: Ferrari spent its energy too soon
Leclerc’s speed trace points to hybrid energy spent too early, while public telemetry’s limits keep Ferrari’s root cause out of reach.
The short version
- Ferrari shifted hybrid deployment earlier in Leclerc’s lap, leaving less electrical assistance on Zandvoort’s final straight.
- His Q3 top speed there finished about 15 km/h below his Q1 run, though the battery’s state remains private.
- Public traces can identify acceleration losses and credible mechanisms, but not component failures or exact state of charge.
Ferrari spent its electrical energy too early at Zandvoort. By the end of Charles Leclerc’s Q3 lap, the speed trace was holding a tiny cardboard sign: battery assistance needed.
From Turn 14 onto the main straight, Leclerc’s top speed was about 15 km/h below his Q1 run that day. Ferrari had moved hybrid deployment into earlier sections as qualifying progressed, leaving less electrical assistance near the line. Calling this a generic power deficit lets the engineering choice off too easily.
The power existed. Ferrari spent it in the wrong places.
Ferrari’s deployment map ate dessert first
An F1 car has limited electrical energy per lap. Its control strategy sends that assistance to the acceleration zones promising the biggest lap-time return. At Zandvoort, telemetry showed Ferrari shifting deployment toward Turns 2 and 3, then the faster sections later in the lap. That can improve acceleration after a corner or carry more momentum onward, but the battery budget must still balance by the finish. By Q3, Leclerc reached the final stretch with less electrical help and his speed curve flattened. The combustion engine kept working; the combined power unit simply contributed less where the public graph made it obvious. Ferrari ate the antipasto, primo and secondo, then looked offended when dessert never arrived.
Leclerc’s description supports that reading. PlanetF1 reported on August 22, 2026, that he felt less power-unit assistance than expected in some areas and more in others. The available material lacks a complete verbatim transcript, so I won’t quote words I cannot verify. His account still matters: that uneven assistance matches the trace’s changing acceleration.
The causal chain is clean. Ferrari changed the deployment map during qualifying, spending more electrical energy in selected sections and leaving less for the run from the final corner to the timing line. Leclerc’s Q3 speed over that stretch finished about 15 km/h below his Q1 baseline. This does not prove the battery was empty, damaged or outside Ferrari’s plan. It proves the distribution changed and final-straight acceleration suffered. Without Ferrari’s private state-of-charge and torque-request data, I cannot calculate the lap-time trade. I can judge the outcome: whatever Ferrari gained earlier did not cover the loss at the end.
Terminal speed alone can drive analysis into clown-shoe territory. The Race found another mechanism when comparing George Russell and Lando Norris during sprint qualifying at the same Dutch Grand Prix. Russell peaked about 10 km/h faster near the line than Norris, who reached roughly 307 km/h, yet Russell’s weak middle sector came from poorer performance through the high-speed corners. Energy saving on the straights did not explain it. Similar speed gaps can reflect completely different compromises, useful context before somebody records seventeen angry YouTube videos over breakfast.
The Race wrote:
But despite Russell's form in edging out Lando Norris's McLaren showing that the W17 is still very strong, tucked away in the data is a clear warning signal that Mercedes may not be able to wait much longer before needing to bring more.
How F1 telemetry data reaches the graph
Public telemetry looks immediate because a line glides neatly across the screen. Underneath, measurements and timestamps must stay attached to the correct point on the lap. Downstream systems ingest and store the stream by session. A public publisher selects releasable channels and packages them into files for plotting software, which aligns two laps and connects discrete samples into a smooth curve. Misaligned timestamps can move an apparent lift or acceleration event. Missing context can make unlike laps look comparable. I trust a polished telemetry chart about as much as a restaurant serving sushi, carbonara and tacos from one laminated menu.
Sim Racing Setup wrote:
However, comparing your data to drivers that are faster can transform how you approach a track.
Now the annoying honest bit: the supplied primary sources do not document the full sensor-to-ECU-to-radio-to-trackside path in a current Formula 1 car. Describing every hop would require engineering fan fiction. General Motors reveals some downstream architecture in a motorsport data-engineering job description: its systems ingest high-frequency telemetry with simulation, wind-tunnel and trackside data through real-time and batch pipelines using streaming and lakehouse technology.
One published estimate says a modern F1 car produces about 1.1 million data points per second, per car rather than across the grid. No supplied primary technical specification defines “data point” or explains how the estimate was tested. I use it only to show scale, with a large asterisk hovering overhead like a badly mounted rear wing.
The F1 26 game provides a simpler, documented example of telemetry transport. Once enabled, it sends UDP packets to a configured IP address and port while the player drives. The receiving platform needs the matching UDP format and required 60 Hz send rate; one wrong field leaves the app staring into the void. For multiple applications, the game can send through SimHub, which forwards packets to another telemetry platform so several tools can consume the stream. A VPN may break the connection by rerouting packets through another IP address. Sim Racing Setup publishes no packet-loss or latency measurements comparing direct UDP with SimHub forwarding, so its guide explains both configurations without proving which is more reliable.
Formula 1 teams use a vastly more sophisticated system, though the supplied sources omit its complete route. The game still demonstrates the requirement behind every trace: values must arrive in order and remain synchronized with the right moment on track. A gorgeous chart built on bad alignment is an expensive lie with anti-aliasing.
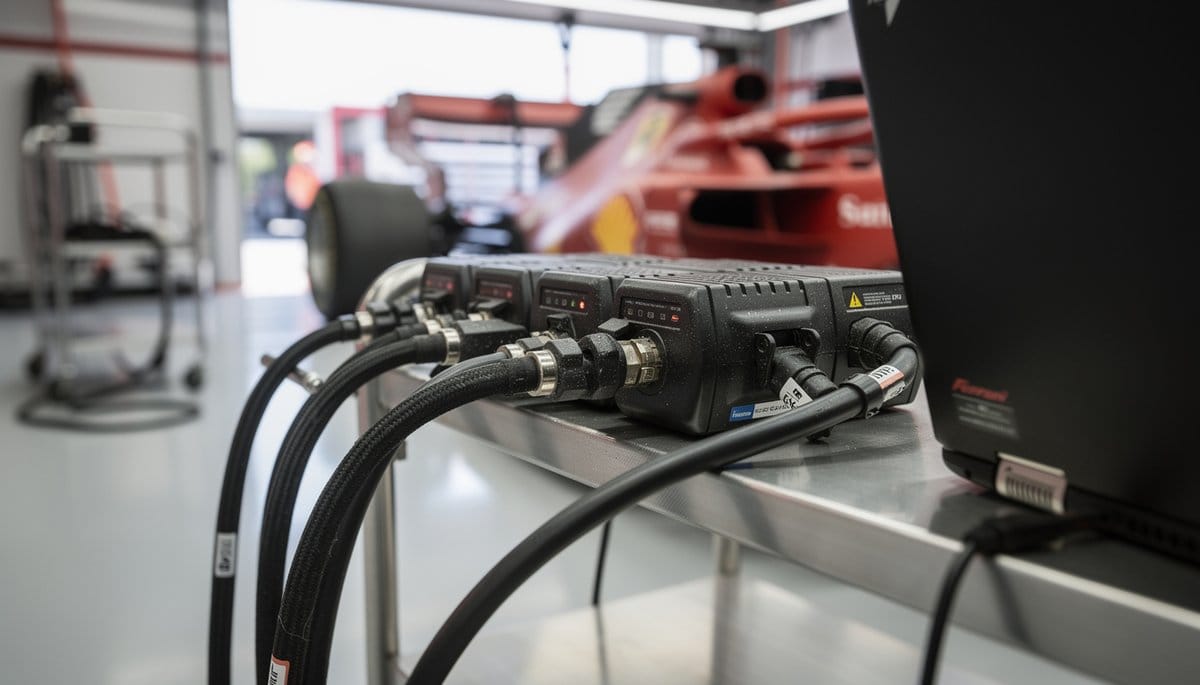
Public files add more processing. TracingInsights organizes each Grand Prix weekend by event and session, with current-season files typically appearing about 30 minutes after a session ends, faster than building a dataset by hand. But they remain processed data, and the supplied material does not establish every public channel’s original provenance, calibration or completeness.
Where the trace stops talking
I read public telemetry by confidence level. First comes direct observation: Leclerc’s acceleration weakened on the final stretch. Ferrari’s changed hybrid deployment offers a credible mechanism because energy distribution shifted during qualifying and Leclerc reported uneven assistance around the lap. Explaining why Ferrari chose that map requires private battery and control-system data. Maybe engineers expected a bigger gain earlier; maybe another limitation forced the compromise. The supplied evidence cannot decide. Public traces clearly show the acceleration loss and persuasively support the deployment mechanism, but the root cause stays behind Ferrari’s garage doors. Social media usually vaults over that boundary wearing flip-flops.
Fuel correction shows how quickly telemetry moves from measurement to modelling. As fuel burns, the car gets lighter and naturally faster. TracingInsights corrects for this using roughly three hundredths of a second per lap for every kilogram carried, compared with a lap carrying no remaining fuel weight. The calculation assumes a full starting load and linear fuel consumption throughout the race. F1Briefing raises the key objection: because actual fuel loads and car weights are unavailable, the correction can distort comparisons. None of the supplied sources validates the model against teams’ actual fuel loads or quantifies its error.
I still use corrected data, but keep the assumptions attached like the warning label on supermarket tiramisù. The model estimates how much pace may come from lost fuel weight; it cannot transform a public file into Ferrari’s private simulation.
The same boundary applies to Leclerc’s lap. Ferrari redistributed hybrid energy, and acceleration weakened on the final stretch. One speed line cannot identify a failed component, reconstruct battery state of charge or calculate the floor’s contribution. Trying is spreadsheet astrology.
Before the 2026 season ends, another flat Ferrari speed trace will be diagnosed online as an engine problem within minutes. I’ll wait for the deployment shape. Maranello has already shown where the more expensive mistake can hide: inside software that spends the lap’s energy before the lap is over.
Frequently asked questions
What is F1 telemetry data?
F1 telemetry data is a time-aligned stream of measurements that plotting software maps to positions on a lap. Public publishers select releasable channels, package them by event and session, and connect discrete samples into curves. The charts can compare acceleration and speed, but their accuracy depends on synchronized timestamps and sufficient context.
What did Ferrari’s telemetry show at Zandvoort?
Ferrari’s public telemetry showed Charles Leclerc’s acceleration weakening from Turn 14 to the timing line in Q3. His top speed over that stretch was about 15 km/h below his Q1 baseline. The pattern supports changed hybrid-energy deployment, but it does not prove an empty or damaged battery.
Can public F1 telemetry prove why a car is slow?
Public F1 telemetry can identify where acceleration or cornering performance changed and support a credible mechanism. It cannot establish a root cause that depends on private state-of-charge, torque-request, fuel-load, calibration, or control-system data. Similar terminal-speed gaps can also result from different compromises elsewhere on the lap.
Sources
- 2026 Public F1 Telemetry Data, Dutch Grand Prix
- Dutch Grand Prix 2026, Telemetry Analysis
- Document 22, Car 55 Driving Unnecessarily Slowly During Sprint Qualifying
- Document 52, Car 10 Alleged Unsafe Release
- F1 telemetry processing with Azure Data Explorer
- F1 TV Pit Wall Data: What Fans Get