
When it breaks: pick your Ollama alternative by layer
A practical guide to choosing llama.cpp, vLLM, SGLang or LocalAI by isolating the failing layer, workload and…
The short version
- The best Ollama alternative replaces the failed layer rather than rebuilding the entire local inference stack.
- llama.cpp isolates local GGUF issues, while vLLM improves shared-GPU throughput through continuous batching and cache scheduling.
- Readers should benchmark their exact hardware, concurrency, context length and cache state before switching runtimes.
One Ollama binary change cut generation speed about 80% on an RTX 3090. I have lost Saturdays to bugs like this, reaching dinner with the same problem, three new config files and the emotional stability of a Ferrari strategist in the rain. My default Ollama alternative is llama.cpp for direct local GGUF inference. I choose vLLM for a shared GPU server. SGLang gets a seat after winning a benchmark on my workload. LocalAI makes sense when I need one API across different backends.
Ollama bundles an inference engine, model packaging, templates, memory decisions and an API. Replacing everything because one layer misbehaves is expensive debugging cosplay.
Karine Brunet said:
Today’s organisations operate in highly interconnected technology ecosystems where complete independence is rarely achievable.
Replace the layer that failed
My first question: what should the replacement remove?
Direct llama.cpp removes Ollama’s runner and packaging choices while staying close to upstream GGUF support. vLLM replaces the single-user launcher mindset with concurrent-request scheduling. SGLang offers specialized execution paths that can fly with the right model and traffic. LocalAI provides one endpoint for several backends.
Each move changes a different boundary and gives bugs new hiding places. If I cannot name that boundary, I stay put.
For one person running quantized models on a laptop or workstation, I choose llama.cpp first. It gives me direct control over context settings and GPU offload, plus model support soon after upstream release. Fewer cushions around the rough edges make diagnosis easier. If a model fails identically in llama.cpp and Ollama, I inspect the file or hardware backend. If it works upstream but breaks through Ollama, I suspect the integration layer. That comparison has saved me more time than every “ultimate local AI setup” video combined.
vLLM earns its electricity when several requests share a GPU. A lone chat session leaves different hardware idle than a crowded queue, so one single-stream result says little about the server users will experience. Continuous batching combines decode steps from active requests. The scheduler assigns KV-cache blocks as sequences grow, then releases them when requests finish. Prefix caching reuses work when prompts share an opening. Queue limits and cache placement shape wait times under load. This machinery is absurd for one post-lunch chat. It becomes useful when other humans depend on the box.
Martin Merz said:
La résilience numérique de l’Europe repose sur une souveraineté à la fois sécurisée et scalable.
SGLang requires the same discipline. In one small deployment, enabling data-parallel attention fragmented the radix cache across ranks. The reporter linked that split to fewer prefix-cache hits and slower first tokens for repeated prompts. Spreading requests across workers made useful prefixes less concentrated, so later requests could land on a rank without cached state and repeat prefill work already done elsewhere. A separate Vulkan change raised the row-ID-hoisting limit for a model with more experts. That stopped each expert-matmul workgroup repeatedly scanning the routing tensor and improved prefill. Tiny implementation details decide whether optimizations help or quietly set your benchmark on fire.
LocalAI solves another annoyance: one familiar API over machines running different backends or model formats. That abstraction adds another layer to inspect, so I do not install it as decoration. Adapters reproduce after midnight.
llama.cpp tells me where to look
One reported Ollama regression dropped Qwen3-VL 8B generation from about 129 tokens per second to roughly 26 on the same RTX 3090 setup. The model stayed fully resident, and swapping the physical cards showed the slowdown followed the Ollama binary. Another GPU would have been a wonderfully premium alternative to checking the executable.
I therefore reproduce failures in direct llama.cpp before migrating permanently. Ollama accepts the request, applies its model template and launches its bundled runner, which calls kernels selected for the hardware. A direct llama.cpp test removes several steps while preserving much of the inference path. Matching failures point toward the model or backend; different results suggest bundling or request handling. Minutes produce a useful hypothesis, beating random flags until the machine senses fear.
My setup offers a quieter example. On an M3 Max with 128GB of unified memory, my roughly 21-billion-parameter gpt-oss model used MXFP4 and stayed fully resident.
The larger gpt-oss model also stayed resident. It has about 117 billion parameters and uses the same MXFP4 format.
The smaller model generated about 74 tokens per second versus roughly 51 for the larger one. Prompt processing split further: about 756 tokens per second versus 215. Time to first token rose from roughly four seconds to six. I ran both tests on August 25, 2026.
That matters during agent work. A slower generation rate adds a pause to every tool call, compounding until I stare at the terminal like an Italian uncle waiting for someone to admit the pasta is overcooked.
Meanwhile, my RTX 5060 Ti was running ComfyUI. Ollama saw only 150MB of free VRAM, so the language model ran entirely on the CPU. Installing vLLM would not free the card from image generation; software remains tragically unable to negotiate custody between my hobbies.
Distrust capacity calculators that hide assumptions. Weights may fit while the KV cache or activations consume the rest, and another process can claim the card before startup. Architecture can also wreck a tidy estimate: a dense full-attention calculation may misjudge a model using sliding windows through most layers. FitLLM’s author has acknowledged that its Gemma 4 calculation assumes something about per-layer token-embedding residency without a direct peak-VRAM measurement. Until somebody measures it, the answer is unknown, preferably without a dramatic red progress bar.
Long context turns VRAM pressure into PCIe traffic
Adaptive KV Cache Streaming is the most interesting recent llama.cpp-adjacent experiment I have seen. Its proof of concept divides KV-cache VRAM between a resident region and shared streaming ring buffer. While the full cache fits, full-attention layers keep KV data resident. When context outgrows that space, cache segments move into pinned system memory and return through the ring buffer as needed. Because decode processes layers predictably, the implementation can prefetch a later layer’s data while an earlier one computes, hiding some transfer time. Enlarging the ring buffer eventually evicts more resident data, adding PCIe traffic for every generated token. Once the link saturates, bandwidth sets the ceiling.
A model fitting in memory therefore says little about performance. KV compression can increase capacity while hurting long-context decode. In one dual-3090 vLLM report, TurboQuant produced a 37% larger KV pool than FP8 under matched serving settings. With a long prompt, single-stream decode was 31% slower than the FP8 baseline. The reporter suspected extra dequantization or rotation work while reading compressed cache positions, though nobody has profiled that explanation.
Streaming has bigger unknowns. Its author calls the current implementation experimental, validated mainly on one NVIDIA GPU and a single server slot. We lack solid measurements across PCIe links and GPU generations. Model architectures may shift the trade-off, while concurrent requests could turn clever prefetching into transfer congestion. I would test it on an internal box, not promise customers its performance.
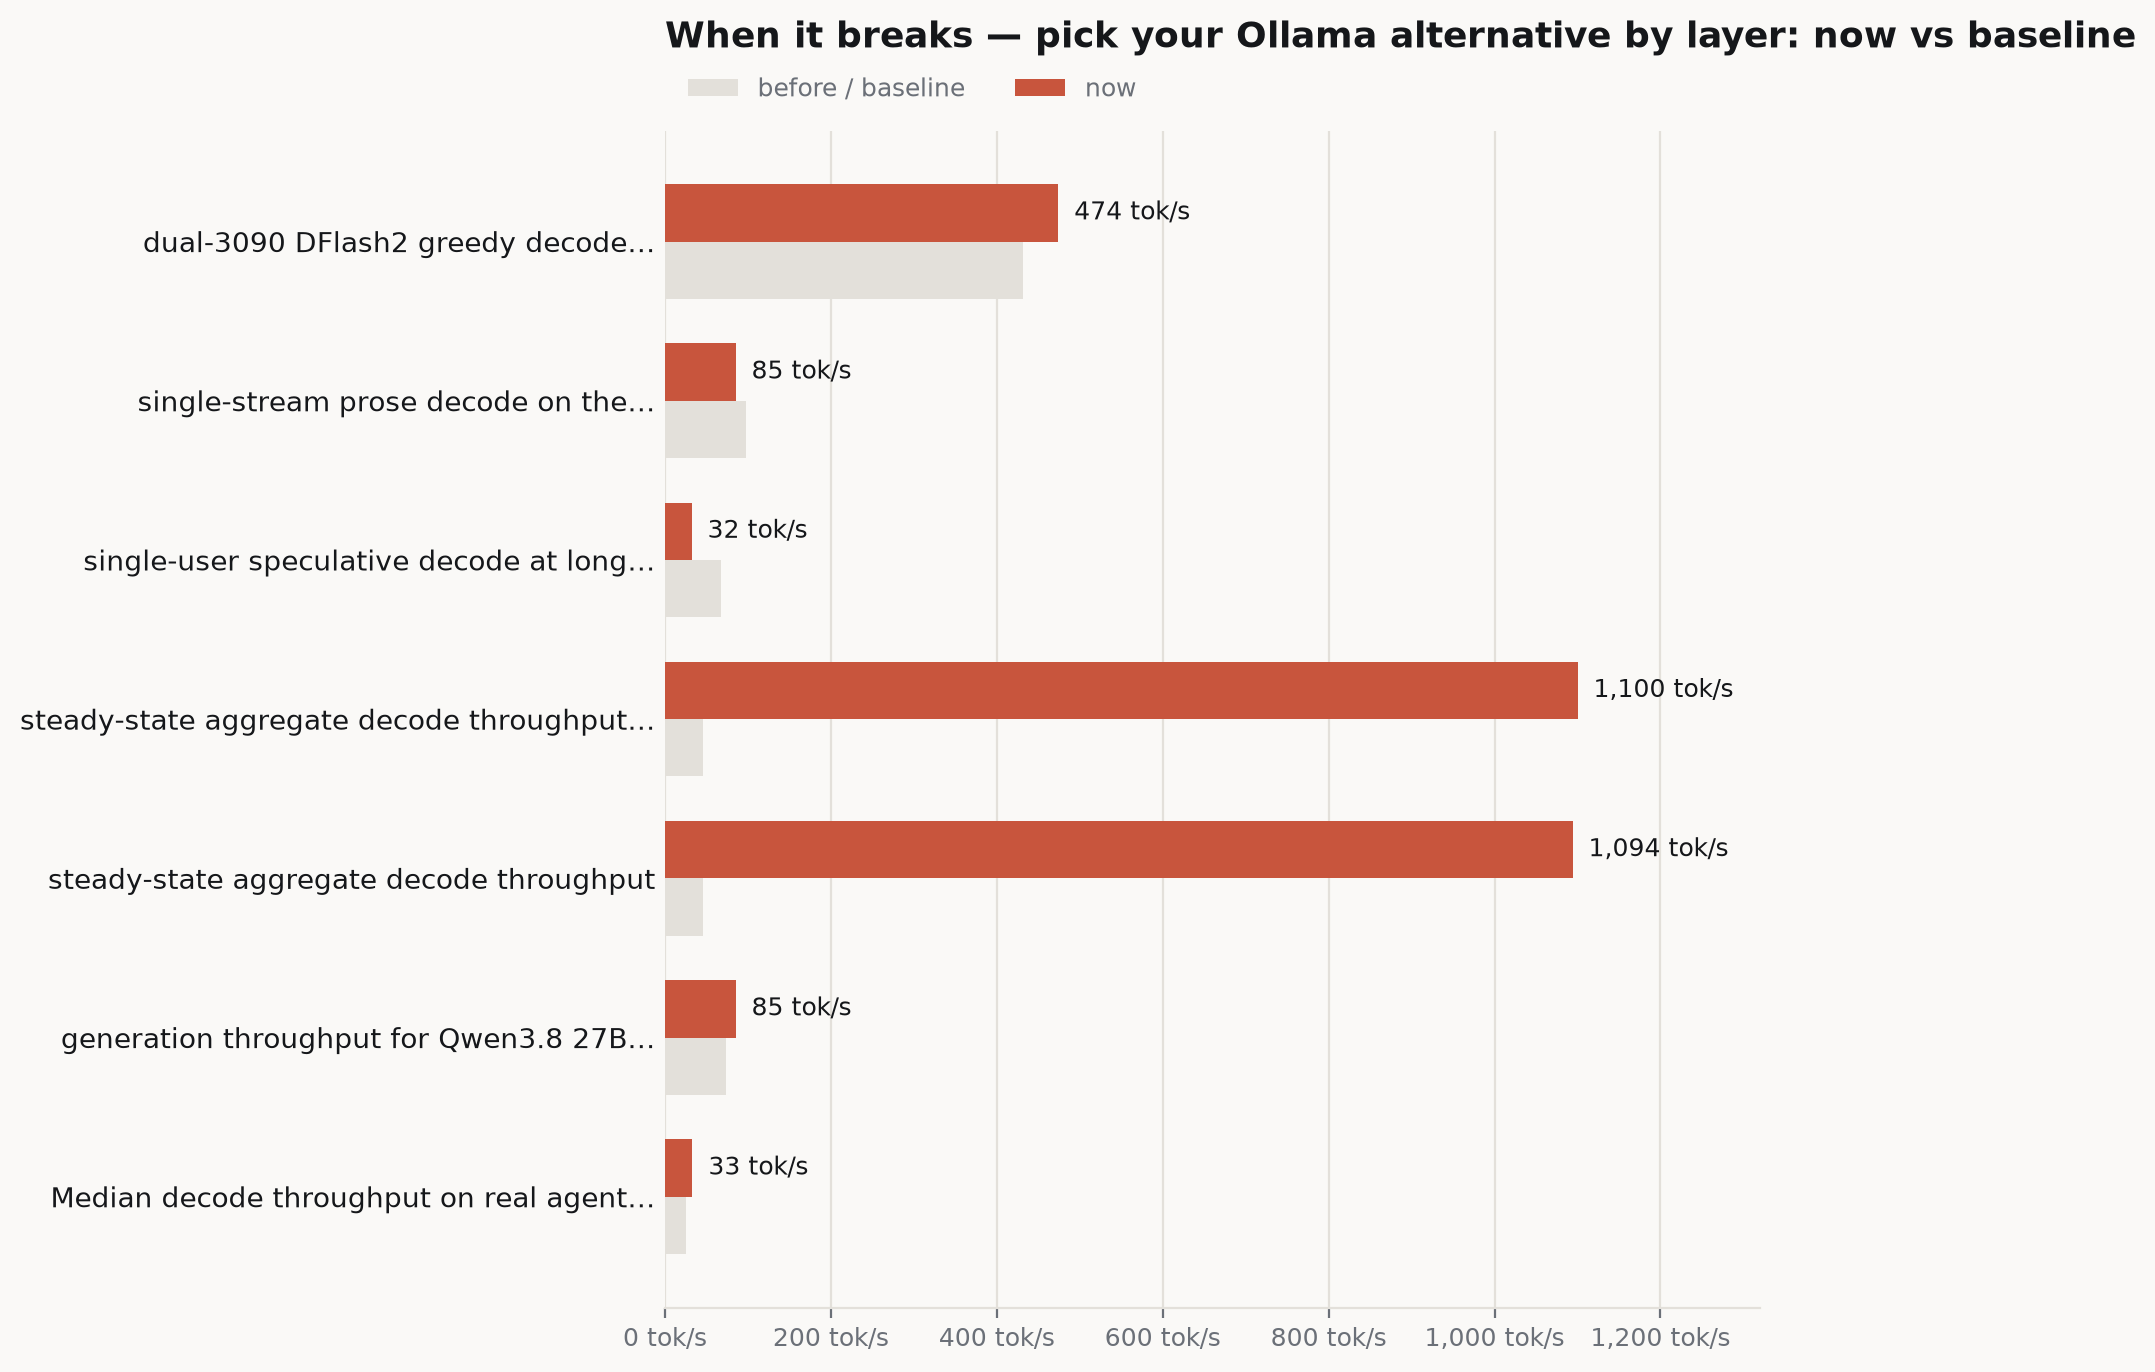
More GPUs buy capacity but charge a communication tax. In one Qwen3.8-27B setup, four cards expanded the DFlash2 KV pool enough for nearly four full native-context requests; two cards could not fit one.
Yet the larger configuration generated prose at about 85 tokens per second, versus roughly 98 on one NVLinked RTX 3090 pair. Four-way all-reduce crossed PCIe between the pairs. More cooks arrived; the kitchen still had one doorway.
Production benchmarks lie with excellent manners
In one batch-mode test, a single RTX 3090 running vLLM produced about 46 aggregate tokens per second with one request. At high concurrency, using short inputs and fixed-length outputs, it reached roughly 1,100. No user received a thousand tokens per second. Batching kept the GPU busy across simultaneous sequences, so aggregate throughput and per-user latency belong in separate columns.
During decode, each active sequence needs relatively little work for its next token. One request leaves much of the GPU’s parallel capacity unused. Continuous batching collects decode steps from multiple requests and runs them together. As requests finish, the scheduler inserts new ones without waiting for the whole batch to drain. Aggregate throughput rises because the GPU stays fuller. Users still share the machine, with latency determined by queue depth and scheduling policy. A giant throughput number on a lonely chart says almost nothing about whether chat feels good.
Prefix caching also bends the curve. One vLLM issue showed that repeated fixed-seed synthetic prompts on a long-lived server may hit automatic prefix-cache entries from earlier runs. A supposedly cold sweep then replays familiar prefixes. As entries accumulate and get evicted, results reflect cache history alongside scheduler behavior. For a cold baseline, I restart the server or generate genuinely novel prompts. Otherwise I am benchmarking déjà vu.
Speculative decoding deserves equal skepticism. A draft model proposes tokens; the target verifies them, and accepted runs reduce expensive target-model steps. A dual-3090 agent evaluation reported DFlash2 running 30% faster than MTP on the same host across prompts with tool calls and JSON. Target verification should preserve the target model’s output exactly, the technique’s strongest argument. Yet one greedy SGLang comparison found deterministic token divergence with Qwen thinking enabled. The target-only repeat remained deterministic, while the no-thinking control matched exactly. One report does not bury speculative decoding, but it makes me compare exact token sequences whenever preservation matters.
I once treated server benchmarks as equipment rankings. Wrong. They describe workloads, and one omitting cache state or concurrency belongs beside a restaurant review that forgets what anyone ate.
Before installing an Ollama alternative, I write one sentence in the issue: “I am leaving Ollama because this specific layer failed.” If it ends at “performance,” the benchmark is unfinished.
By September 2027, local AI teams will have wasted more money replacing GPUs than bad binaries. The winning Ollama alternative will often be the same machine, one layer lower, finally running the code you thought it was running.
Frequently asked questions
What is the best alternative to Ollama?
The best Ollama alternative depends on the failed layer and workload. llama.cpp suits direct local GGUF inference, vLLM suits shared GPU servers, SGLang suits benchmark-proven specialized execution, and LocalAI suits a common API across multiple backends. Replacing only the faulty boundary avoids unnecessary complexity.
Should I use llama.cpp or vLLM instead of Ollama?
llama.cpp is preferable for direct local GGUF inference, especially when diagnosing model, backend, context, or GPU-offload issues. vLLM is preferable when several requests share a GPU because continuous batching, KV-cache block scheduling, and prefix caching can raise aggregate throughput under concurrency.
How should I benchmark an Ollama replacement?
A reliable local LLM benchmark records concurrency, cache state, prompt length, output length, time to first token, and per-user latency. Cold-cache tests should restart the server or use novel prompts. Aggregate throughput must be separated from individual latency because batching can increase total tokens per second without making each user’s response equally fast.
Sources
- Introducing @huggingface/kernels: 200+ WebGPU Kernels for Local AI
- VLM Run Gateway: Run open-weight OCR, VLM and vision models behind one API
- Adaptive KV Cache Streaming: Implementation Approach, Scope, and Common Infra
- Qwen3.8-Flash-Next on Strix Halo, Vulkan only: 33 tok/s decode, 500 tok/s prefill
- Show and tell: auditable KV/VRAM math for SWA, hybrid-linear and MLA models (npx fitllm)
- [RFC]: R3 support for prefill/decode disaggregation